1. INTRODUCTION
Herbal plants contain a great amount of chemical diversity which provides opportunities for new drug formulations either as isolated compounds or as standardizing extracts. Biological activities of plants strongly depend on its constituents especially phenolics. They encompass a very large and diverse group of aromatic compounds characterized by a benzene ring with one or more hydroxyl groups produced by plant secondary metabolites mainly for plant development and protection [1]. A flavonoid is a common group of polyphenolic compounds which have been reported to more than 4500 derivatives having known properties which include free radical scavenging, inhibition of hydrolytic and oxidative enzymes, anti-inflammatory action and anti-corrosive agents [11].
Hibiscus Rosa Sinensis L. is a genus of an evergreen herbaceous plant (Malvaceae) commonly cultivated in all over the world. In traditional, many parts of this plant are proposed to be rich in phytonutrients contributed for its medicinal properties. Its flowers have been used for an aphrodisiac, bronchial catarrh, fever, strangury, cystitis and other genito-urinary troubles, alopecia, and diabetes. Leaves have been treated anodyne, emollient and aperient; gonorrhea, alopecia and also used for blackening hair; the buds reduced burning of the body, urinary discharges, seminal weakness, piles, uterine and vaginal discharges; promote the growth of the fetus; The root is valuable in coughs. (Anil Kumar and Ashatha Singh, 2012). Crude water-ethanolic extract of Hibiscus rosa sinensis leaves were exhibited excellent antioxidant activities comparing to synthetic antioxidants (BHT, BHA) (Faten et al, 2011). However, it is rarely used in Vietnam and often be confused with Hibiscus Sabdariffa. In this study we aimed to qualify and quantify phenolics and flavonoids contents in Hibiscus Rosa Sinensis planted in Ho Chi Minh city.
2. MATERIALS AND METHOD
The fresh leaves of Hibiscus rosa-sinensis were collected from Ho Chi Minh National University campus in Ho Chi Minh city, Vietnam in October 2016. Fresh leaves with uniform structure were chosen and washed with distilled water. After that, samples were air dried till constant weight and then ground to powder. The samples were stored in air tight bags for further periodical uses.
The chemicals used include absolute ethanol, n-hexane, ethyl acetate (EtOAc), methanol (MeOH) purchased from Chemsol Company, Viet Nam. Thin layer chromatography (TLC), aluminum chloride (AlCl3), and sodium carbonate (Na2CO3) were purchased from MERCK, Germany. Folin-Ciocalteu reagent, gallic acid were products of Sigma-Aldrich (St. Louis, MO, USA).
The plant powder was extracted by 15L of 96% ethanol under room temperature for 1 week. Then, the aqueous phase was filtered through Whatman No.l filter paper and the residue was added by fresh ethanol. This process was repeated three times until a clear colourless solution was obtained. The crude extract was concentrated under reduced pressure at 60°C, using a rotary evaporator. Then, the crude extract was soaked by suitable solvent (n-hexane, ethyl acetate, and methanol) to get fraction extractions. Dried extracts were then weighed and stored in a refrigerator. The percentage yield of extract was calculated using the expression. Yield (%) = Amount of dried extract/wt. of sample × 100
A portion of crude extract was used for phytochemical testing for the present of alkaloids, flavonoids, carbohydrates, tannins, steroids, terpenoids using standard procedure (Harborne, 1984; Trease and Evans 2002).
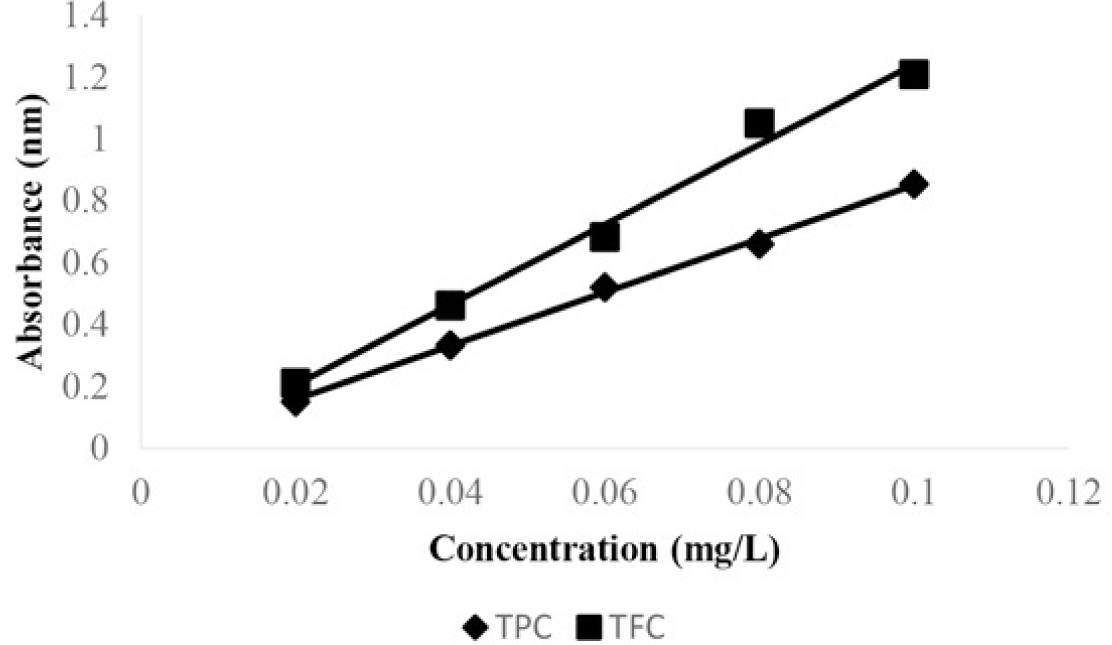
The total phenolics content was determined according to the Folin-Ciocalteu method [17]. The extracts and the standard gallic acid at different concentrations were taken in test tubes and 1.5 mL of FC reagent (10%; w/v) was added, after 5 minutes add to the mixture 1.5mL of sodium carbonate (20%; w/v). After incubation for 5 min, the mixtures were allowed to stand for 2 hours under dark condition. The absorbance was measured at 750 nm in a spectrophotometer. The concentration of total phenolics is expressed in terms of gallic acid equivalence (mg GAE/g).
The total flavonoids content of H. Rosa extract was determined by the aluminum chloride colorimetry assay [12]. Five milliliters extract at 0.4 mg/mL in methanol; 5 mL of 2% AlCl3 solution was added, and the mixtures were allowed to stand for 10 min. Then, the absorbance was measured at 415 nm.
The total flavonoid content was calculated from a calibration curve, and the result was expressed as mg rutin equivalent per g dry weight.
Fourier-transform infrared spectroscopy (FTIR) is a technique recently used to qualify the presence of bioactive compounds from a biological and pharmaceutical sample based on the determination of the interaction between an IR radiation and a sample that can be solid, liquid or gaseous. The radiation absorption of chemical functional groups response at different frequencies, so FTIR will measure the frequencies at which the sample absorbs, and the intensities of these absorptions [3].
All sample extraction and measurement system components was maintained at room temperatures that prevent sample condensation. Stationary source effluent was extracted, filtered and conditioned (if required), and transported to the FTIR gas cell for analysis. If sample conditioning is used, then the condenser system (or another device) should minimize the contact between the condensed water vapor and the effluent. (Standard Test Method for Determination of Gaseous Compounds by Extractive Direct Interface Fourier Transform Infrared (FTIR) Spectroscopy).
Stationary source effluent is directed to the Fourier transform infrared (FTIR) spectrometer gas cell. Individual compounds in the effluent absorb characteristic infrared radiation that is proportional to their concentration. The FTIR system identifies and quantifies multiple compounds simultaneously.
3. RESULTS AND DISCUSSION
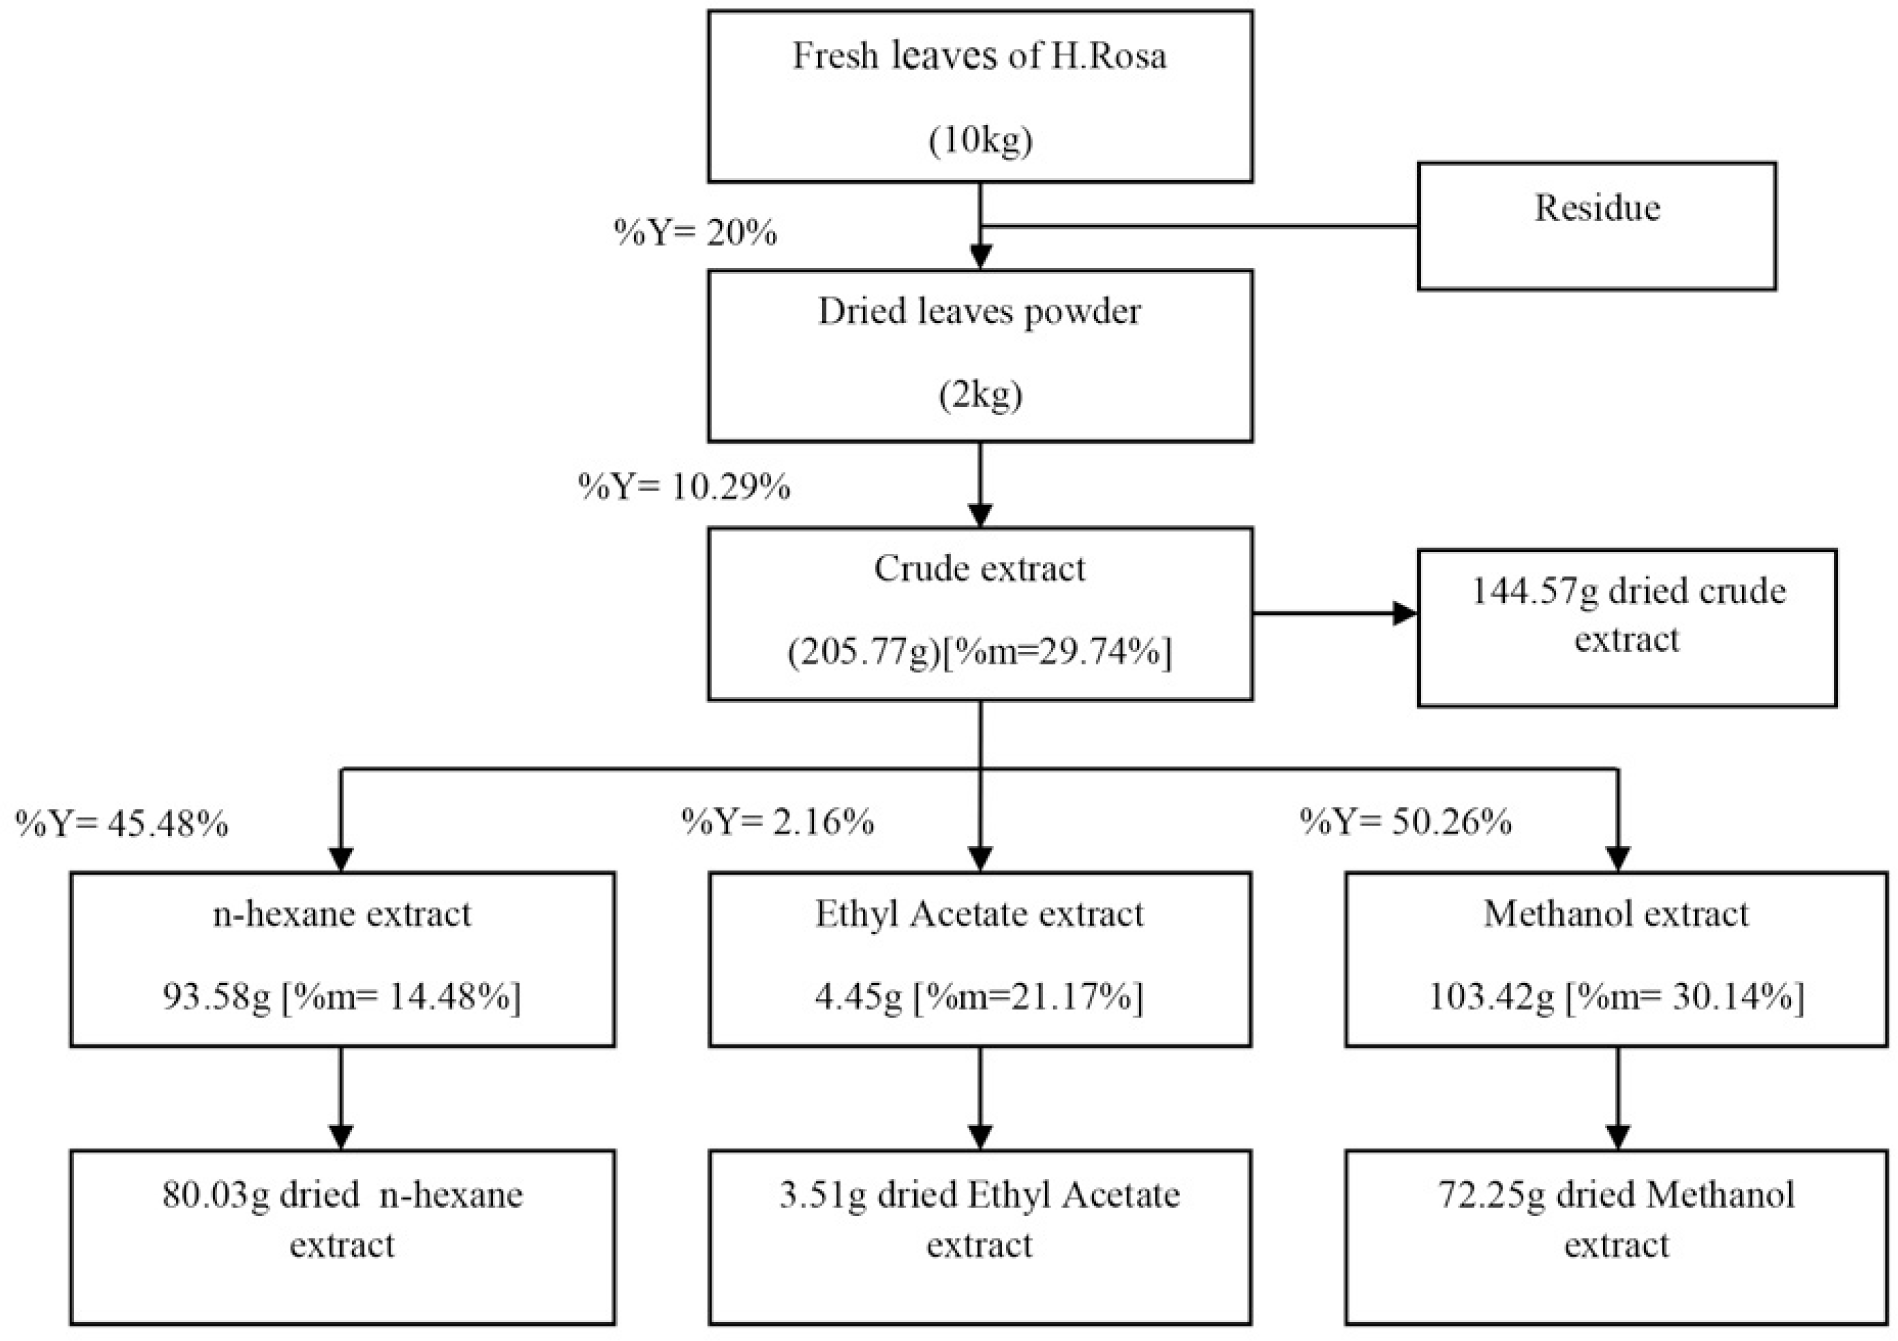
10 kg of fresh Hibiscus Rosa Sinensis L. yield approximately 2 kg of dried powder, 205.77 g of crude extract, 93.58 g of n-hexane extract, 4.45 g of ethyl acetate extract, and 103.42 g of methanol extract. Each extract was measured moisture for calculating dried mass and the productivities. Result are shown in figure 1.
A preliminary phytochemical screening test is not only a simple, quick, and inexpensive procedure but also an important tool in a bioactive analysis that gives a brief summary of phytochemicals in an unknown mixture. According to the preliminary test, there were the present of glycosides, steroids, flavonoids, saponins, and tannins. Alkaloids and coumarin were recorded to not detected in Hibiscus Rosa Sinensis.
These metabolites are widely used in various pharmaceutical preparations. In Asian traditional medicine, the tannin-containing plant extracts are used as astringents, against diarrhea, as diuretics, against stomach and duodenal tumors [4], and as anti-inflammatory, antiseptic, antioxidant and haemostatic pharmaceuticals [5]. Saponins also have many pharmacological properties, such as antifungal, insecticidal, anthelmintic, cytotoxic, anti-inflammatory, immunostimulant, hypocholesterolemic and hypoglycemic [10]. As consequence, this plant has the great economic importance of this group of plant constituents.
| Chemical Constituents | (+) Positive/ (-) Negative |
|---|---|
| Alkaloids | - |
| Glycosides | + |
| Steroids | + |
| Saponins | + |
| Coumarins | - |
| Flavonoids | + |
| Tannins | + |
Polyphenols are the most abundant and widespread components in plants. There are more than 8000 phenolics constituents which have various bioactivities which could be beneficial to human health (Shahidi and Ambigaipalan, 2015; Kuti, 2004). Flavonoids are the major subgroup of polyphenols in plant sources, over 10000 flavonoids have been identified and divided into five main subclasses, including anthocyanidins, flavanones, flavonols, flavones, and isoflavones (Shannon, 2014). Flavonoids maintain various biological functions in plants, including protection against ultraviolet (UV) radiation and phytopathogens, signaling during nodulation, the coloration of flowers as a visual signal that attracts pollinators [7], as well as antioxidant components by free radicals scavenging activities [16]. Therefore, the obtaining of phenolics and flavonoids contents of plant extracts may be the sign to process biological activities.
According to previous studies, Hibiscus Rosa Sinensis is high content of phenolics and flavonoids components [16]. In the present study, results obtained from Hibiscus for its total phenolics content and total flavonoids content (see table 2). The amount of total phenolics varied among four extracts of H. Rosa Sinensis, crude extract, methanol extract, ethyl acetate extract and n-hexane extract were 57.09 ± 0.35 mg/g, 70.98 ± 0.03 mg/g, 21.31 ± 0.01 mg/g, and 18.45 ± 0.003 mg/g as gallic acid equivalent, respectively. This result showed that the total phenolics content were relatively high in methanol extract and crude extract; while total flavonoids content was not significantly differed for crude extract, methanol extract, and ethyl acetate extract 26.87 ± 0.01 mg/g, 21.08 ± 0.03 mg/g, 21.70 ± 0.001 mg/g as rutin equivalent, respectively. The flavonoids content in n-hexane extract was only 14.95 ± 0.02 mg/g. So, the potential of many biological activities is likely to express in these extracts compared to n-hexane.
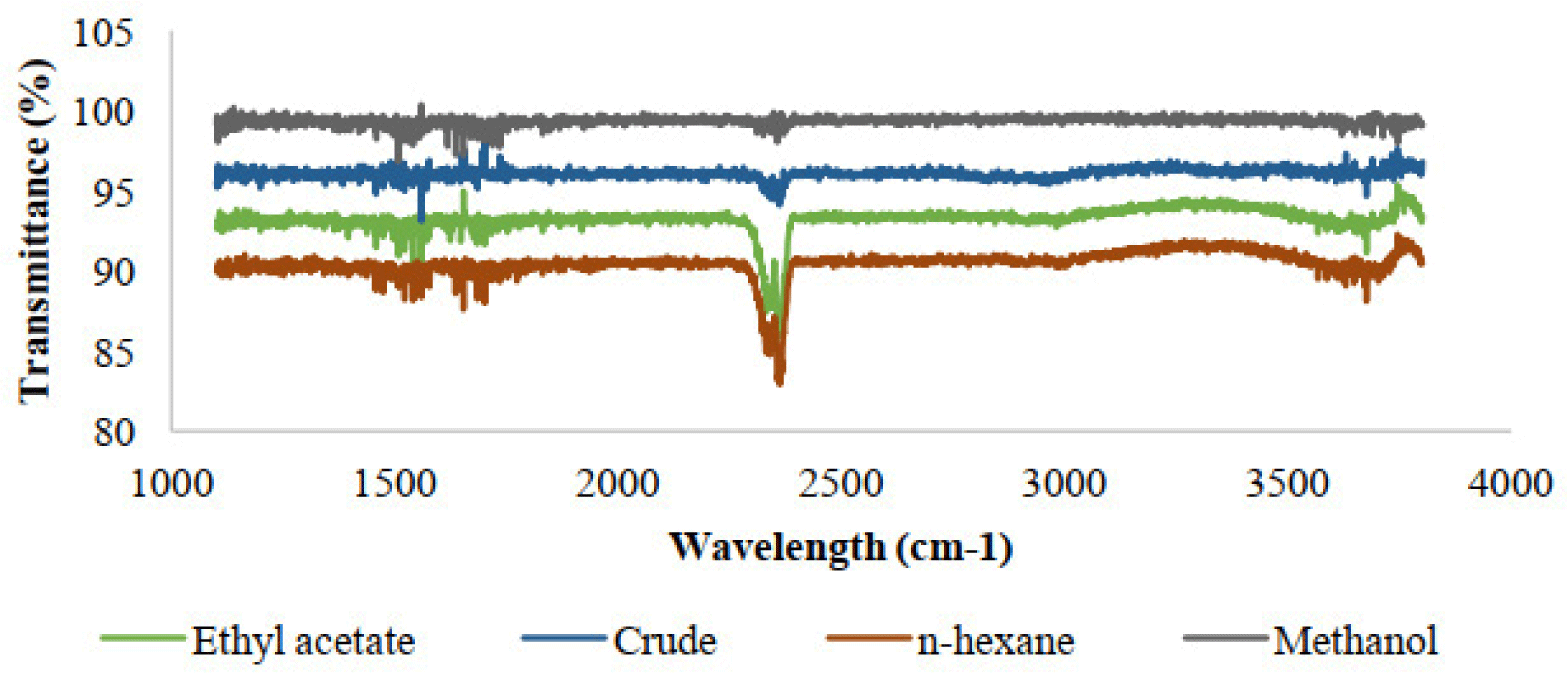
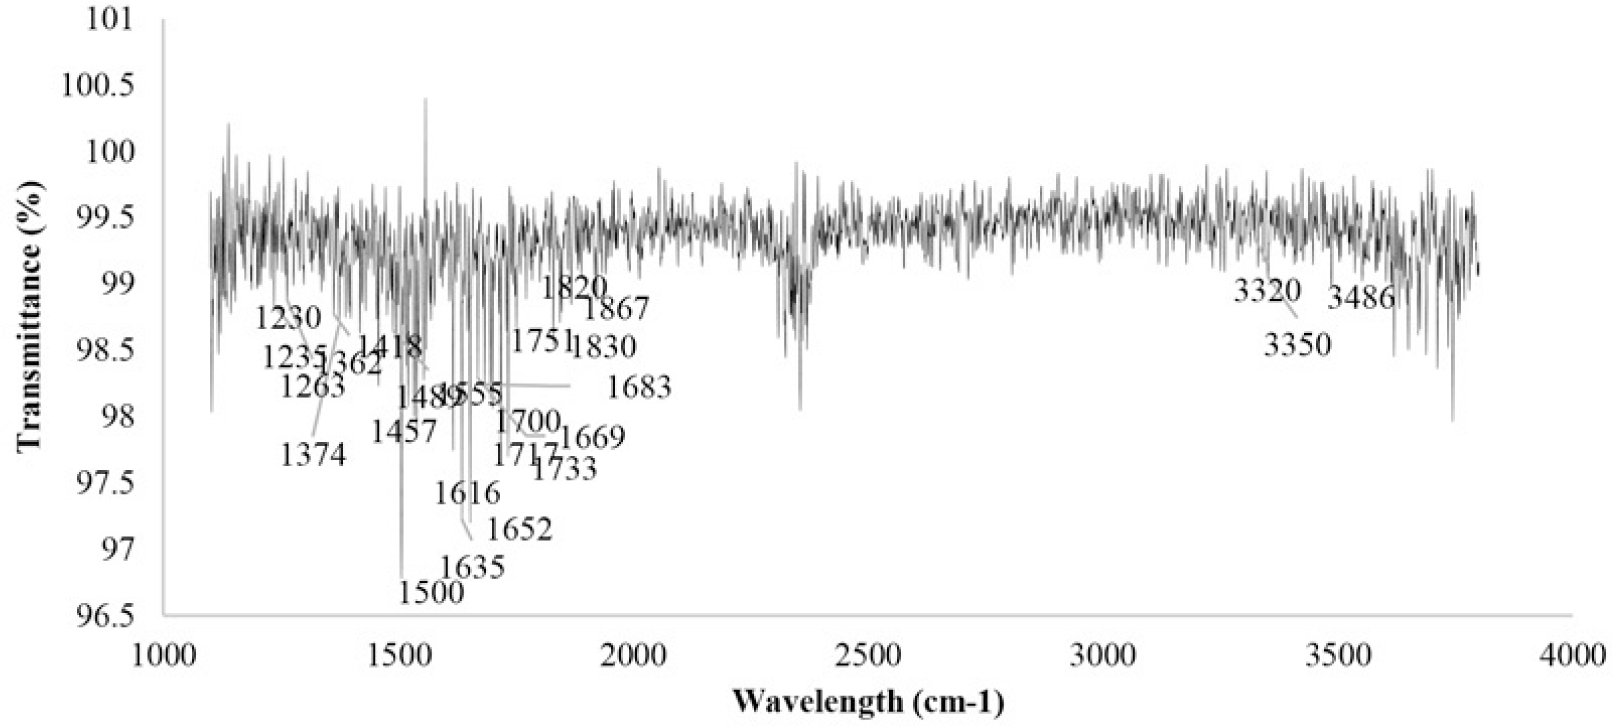
FTIR has been widely used as a valuable tool for the determination and identification of compounds or functional groups present in a mixture of plant extracts (Sasidharan, 2011). One of the advantages of IR spectroscopy is that it has the ability to identify chemical in small quantities without isolation or derivatization, so it can eliminate deactivations and transformations during preliminary preparation. The spectrum of testing compounds can be identified by comparison to a library of known compounds. Hydroxyl or amino groups mainly signal very characteristic band profile in the region 3650-3250cm-1, around 1615-1495cm-1 are consistent with an aromatic compound; while frequencies from 1600 to 1268cm-1, indicate absorption by nitrate, ammonium, aliphatic hydrocarbons, aliphatic and aromatic carboxylic acids, amino acids and carbohydrates [2]. All the spectra of Hibiscus Rosa Sinensis were extracted in different types of organic solvents investigated shared certain spectral similarities (Figure 2). FTIR spectra for extracts are shown in figure 3 indicated the following peaks:1197cm-1, 1230cm-1, 1235cm-1, 1263cm-1, 1362cm-1, 1374cm-1, 1418cm-1, 1457cm-1, 1489cm-1, 1500cm-1, 1555cm-1, 1616cm-1, 1635cm-1, 1652cm-1, 1669cm-1, 1683cm-1, 1700cm-1, 1717cm-1, 1733cm-1, 1751cm-1, 1820cm-1, 1830cm-1, 1867cm-1, 3320cm-1, 3350cm-1, 3486cm-1. The absorptions of extracts were over 3000cm-1, the compound was proved to be likely unstarurated (C=C or aromatic) (Coates, 2000). 1197cm-1 peak corresponds to the secondary amine group; the 1489cm-1, 1500cm-1, 1555cm-1 indicate to aromatic nitro compounds, while the 1616cm-1, 1635cm-1, 1652cm-1, 1669cm-1, 1683cm-1 indicate to Quinone or conjugated ketone or amide; the peaks having the value of 1700cm-1, 1717cm-1 represent for carboxylic acid; the sharp peaks occur at 1733cm-1 and 1751cm-1 probably ester; and five-membered ring anhydride absorbs in 1820cm-1, 1830cm-1, 1867cm-1 peaks; Imino compounds, NH strength absorbs IR light at frequencies around 3320cm-1 and 3350cm-1; while the peak having the value of 3486cm-1 is probably heterocyclic amine, NH strength.


4. CONCLUSION
Determination of phenolics and flavonoids contents is the screening step would help to identify new drug candidates. This study indicates that the extracts obtained from the leaves of H. Rosa Sinensis L. have the high value of total phenolics and flavonoids contents. This result ascertains the potency of extracts from H. Rosa Sinensis as potential pharmaceutical sources. Therefore, the extract from H. Rosa Sinensis is worthy of further studies on isolation and purification of bioactive compounds and chemotherapeutic activities and potential effects in vivo need to be further tested.


