INTRODUCTION
The objective of most epidemiological research is to determine the causal inferences/effects of the exposure on the outcome (i.e, an unbiased estimate of effect for an exposure on an outcome). There are two types of causal effects: individual vs. population; they are defined in counterfactual terms: “Had the exposure differed, the outcome would have differed” [1]. We give here a classical example (modified from [2]) for clearance. On June 1st, Joe received a new kidney (the exposure). Five days later, he died (the outcome). Just imagine that we can somehow know that had Joe not received a kidney transplant on June 1st (all other things in his life is unchanged) then he would have been alive 5 days later. We inferred that the transplant had a causal effect on Joe’s five-day survival. From above example, we understand that for casual effect, we must compare the actual outcome (i.e. Joe died after 5 days) to the potential outcome (i.e. death or alive) under the counterfactual condition (i.e, Joe had not received a kidney transplant). If the actual outcome differs compared to that of the potential outcome under the counterfactual condition, we define that the exposure had a causal effect on the outcome. Similarly, at the population level, consider a dichotomous exposure variable A (1: exposed, 0: unexposed) and a dichotomous outcome variable Y (1: death, 0: survival). The Pr[Ya=1=1] is defined as the probability of the outcome occurring when the entire population is exposed; and the Pr[Ya=0=1] is defined as the probability of the outcome occurring when the entire population is un-exposed. Then, the exposure had causal effect in the population if Pr[Ya=1=l] - Pr[Ya=0=1] ≠ 0. In reality, a population cannot simultaneously receive different exposure status, however, we can use observed data to infer the probability distributions of counterfactual variables (i.e., under exchangeability assumptions). In an ideal randomized experiment, the following equations hold true:
with Pr[Y=1|A=1] is defined as the conditional probability of the outcome occurring in the subset of the population who exposed; and Pr[Y=1|A=0] is defined as the conditional probability of the outcome occurring in the subset of the population who un-exposed. Therefore, the population casual effect of an exposure on the outcome is estimated from Pr[Y=1|A=1] - Pr[Y=1|A=0] using only observed data. In non-experimental studies (i.e, observational studies), to make the equations (1)(2) hold true; it requires some covariates adjustment. The question then what covariates we should adjust for to generate exchangeability and avoid bias.
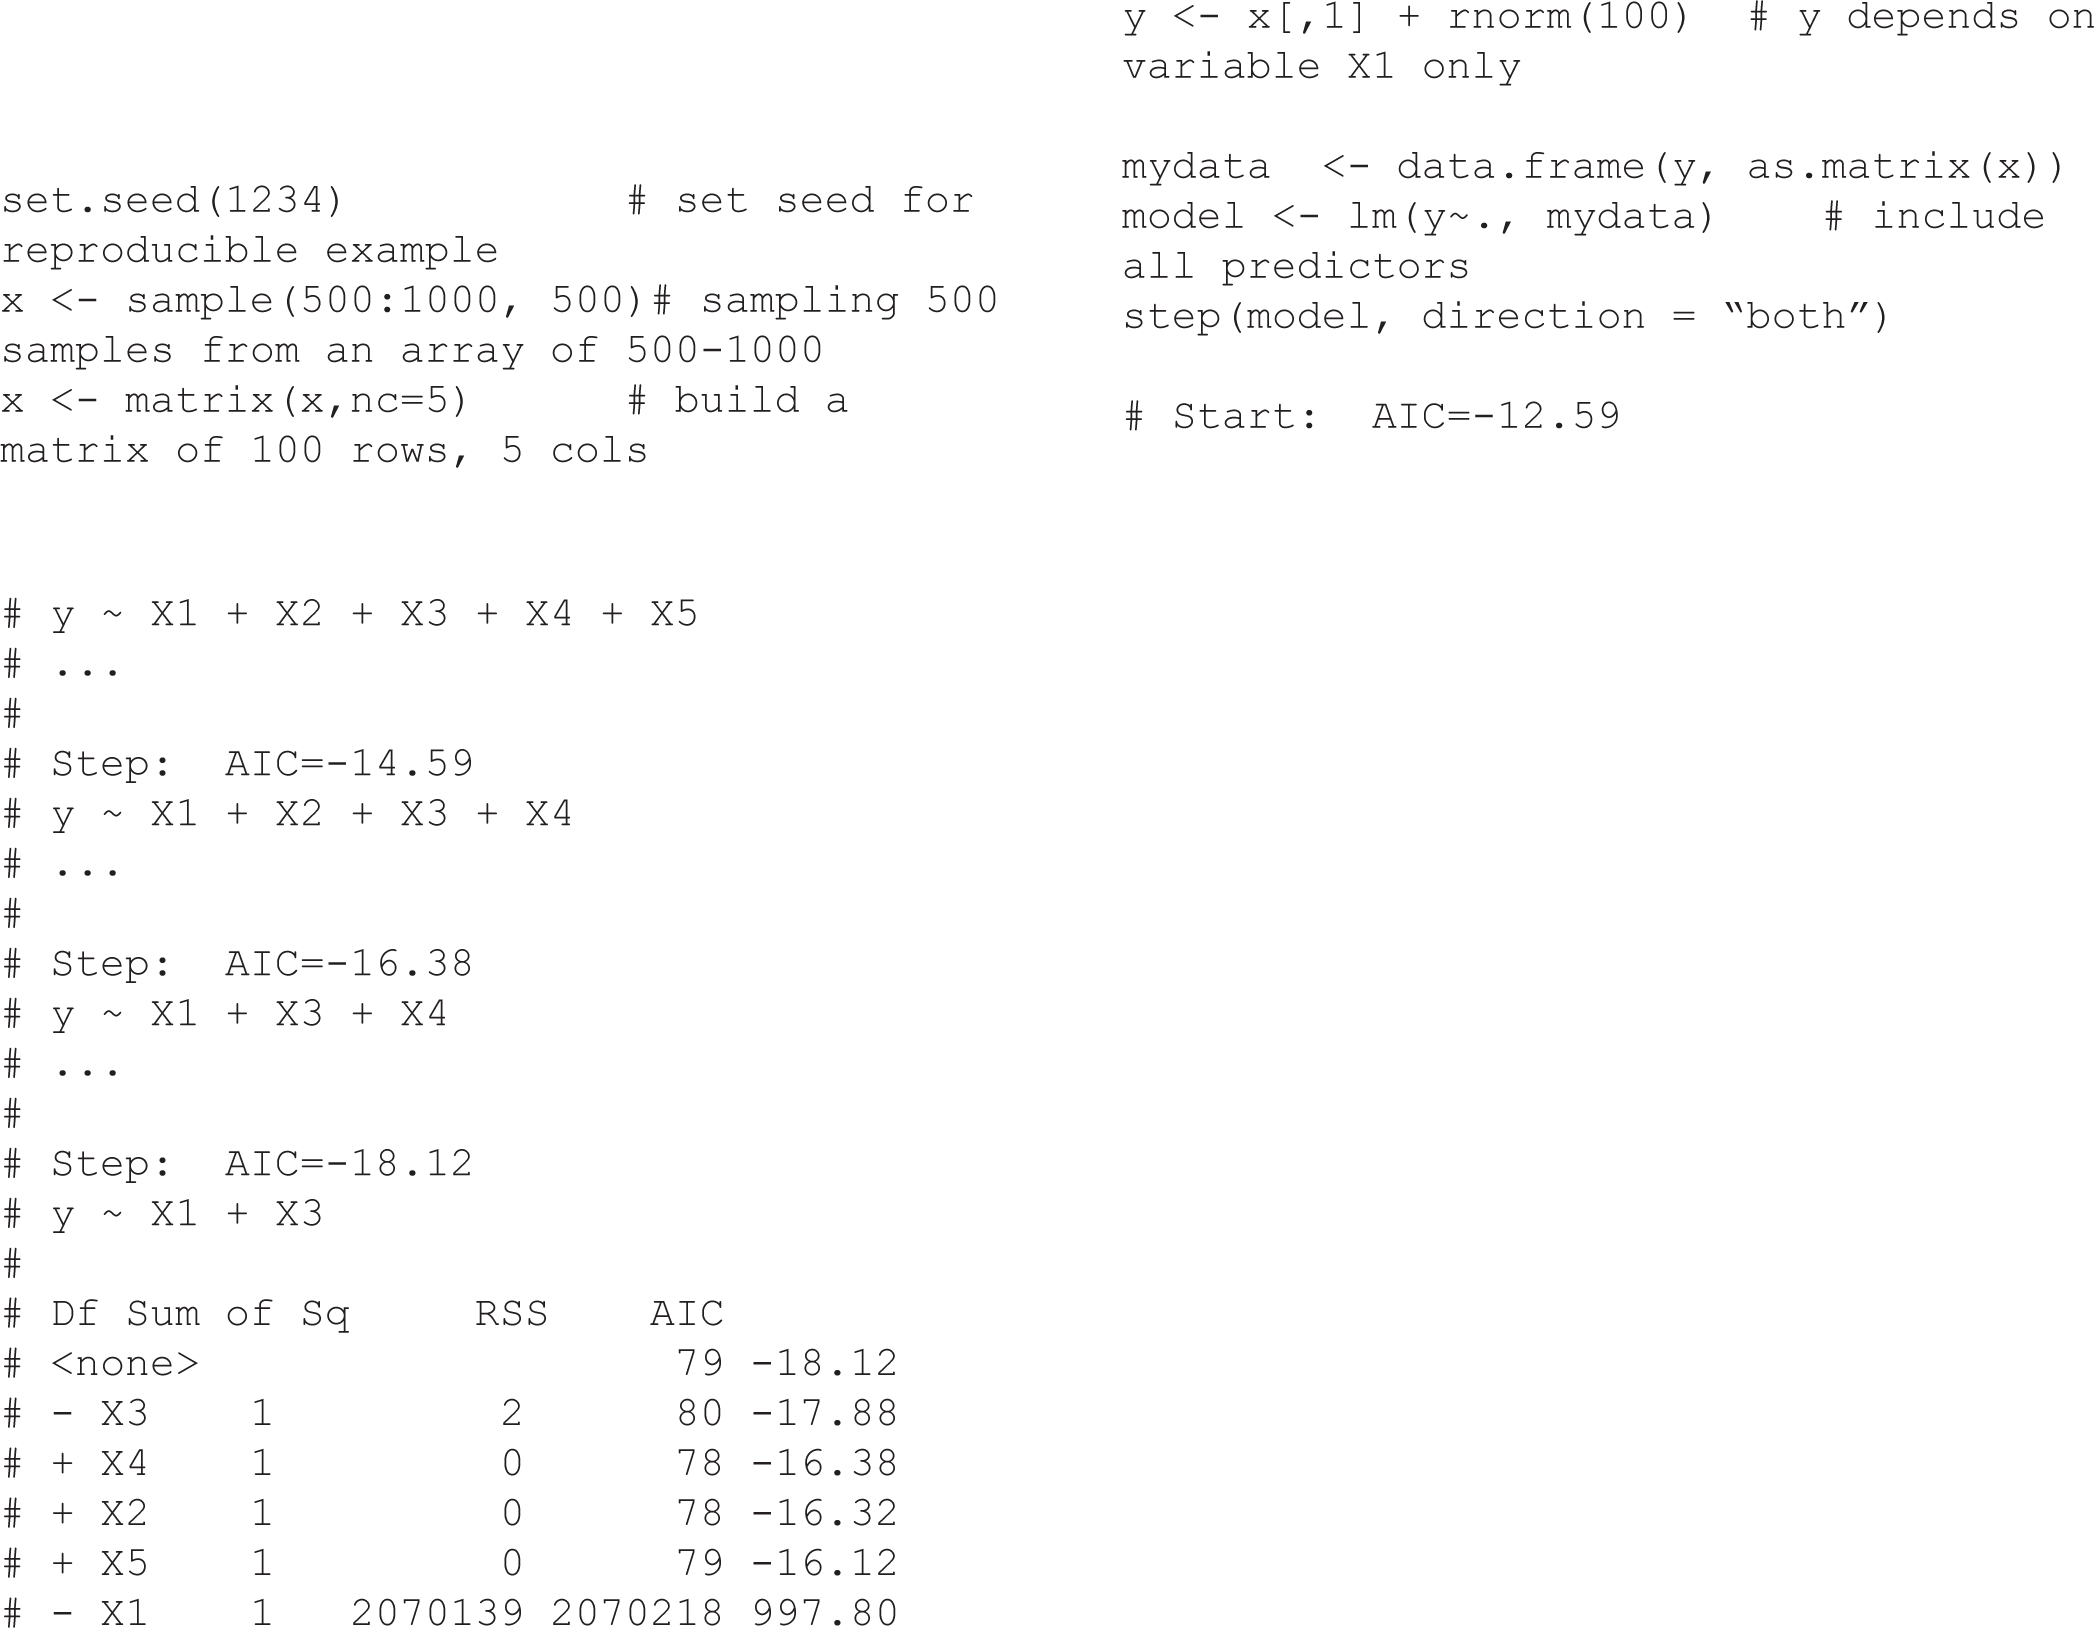
The traditional approach of estimating causal effects in observational studies is to adjust for a set of variables judged to be confounders by including them in a multiple regression model. The univariate analysis based method use p-value threshold (e.g, p-value ≤ 0.2) to include factors from univariate analyses into multiple regression models [3], while stepwise (forward/backward) are automatic variable selection procedures using p-value or other selection criteria (such as AIC, BIC). The implicit assumption underlying the above-mentioned approach is that, although not all variables selected will be confounders, all important confounders will be selected [3]. Regularization based methods like Lasso or Ridge regression consist of shrinking the model coefficients by penalizing the ones that close to zero. Another method compares adjusted and unadjusted effect estimates, in which, if the relative change after adjustment for certain variable is greater than 10% (or 20%), for example, then the variable is selected. The implicit in this approach is that any variable substantially associated with an estimated change is worth adjusting for [4]. Structural equation modeling (SEM) is another statistical tool for evaluating the relations in epidemiological research, particularly in behavioral science [5]. However, all of these strategies relied only on statistical artifacts without any biological or clinical relationships and that may lead to bias due to the omission of important confounders or inappropriate adjustment for non-confounders. In order to demonstrate that Stepwise automatic variable selection may obtain an inappropriate result, we conducted a simulation (see R code in Supplementary section). In this case, although we generated variable y (i.e., the outcome variable) that depended only on variable xl, the Stepwise selection using AIC suggested both variables xl and x3 were associated with the outcome variable. Some other typical examples such as the effectiveness of HIV treatment [6] or the Birth weight paradox shows the paradoxical results when examining the causal effects of exposure during pregnancy on perinatal outcomes due to inappropriate adjustment for birth weight [7]. From my observation, the adjustments using only “statistical artifacts” methods as mentioned above, are widely teaching in Epidemiology and Biostatistics but without appropriated notice on the biological or clinical relationships between exposure and outcome which may induce the bias in estimating causal effects. In the next section, we introduce an interesting method, namely Directed Acyclic Graphs (DAGs), which can be used to reduce the bias in estimating causal effects; it is also a good application for Epidemiology and Biostatistics teaching.
Directed Acyclic Graphs is a method relied on biological and clinical relationships and to help examine if bias is potentially reduced or increased when conditioning on variables, and finally identify sets of variables called sufficient adjustment sets that if adjusted for, would yield asymptotically unbiased estimates of the causal effect of interest. The “directed acyclic graphs” name is given by: (1) “graph” is a structure composed of a set of nodes (or vertices) that correspond to the variables or factors, and some pairs of nodes are connected by a straight line called edge or arc indicating their relationship; (2) “directed” indicates that those edges have a direction associated with them; and (3) “acyclic” means that the edges are not oriented in the same direction, forming a cycle. In theory, a confounder is defined as an extraneous factor that fully or partially accounts for the observed effect of the exposure on the outcome [8]. DAGs provide a more visible definition that variables become confounders if they have met the following criteria (1) causally associated with the exposure; (2) causally associated with the outcome conditional on the exposure; and (3) not in the causal pathway between the exposure and the outcome [8]. For instance, variable C is a confounder for the relation between the exposure E and the outcome O (Figure 1a) because there are arrows from C to E and C to O indicate that they are causally associated, and C is not on the causal path from E to O. In contrast, variable X in the Figure 1b is not a confounder but a mediator variable since X is involved in the causal path from E to O, indicated by two edges directed from E to X then from X to O. Therefore, to estimate the effect of E on O, we need to adjust for confounder C according to Figure 1a, but X is not a confounder according to lb. The adjustment of X in Figure 1b related to the terms of direct and indirect effects that discussed comprehensively on textbook of mediation analysis [9].
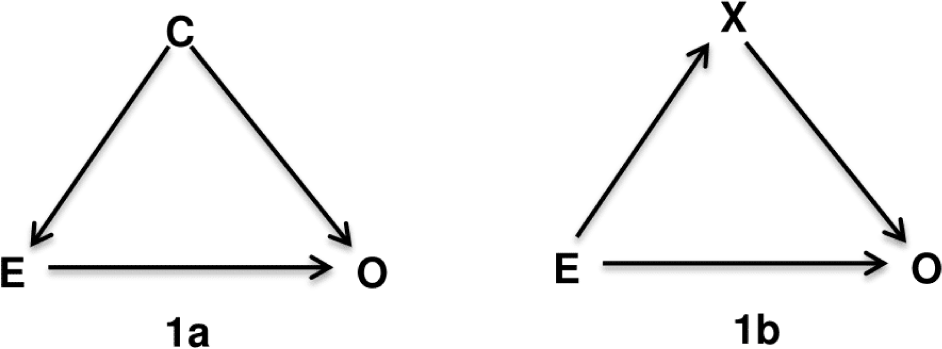
There are many terms involved in DAGs theory that we could not cover here, we invite the reader to refer to the chapter 12 of epidemiology textbook by Rothman, KJ.; Greenland, S; Lash, TL for details [8]. The two terms: backdoor paths and colliders we mentioned here is to help to explain the following example (shown in Figure 1). The backdoor path is a path that goes against the direction of the arc on the path, but can then follow or oppose the direction of any subsequent arc [8, 10]. To illustrate, in Figure 1a we first start with E and move in the reverse direction of the path directing to C, then move in the same direction to O. The path from E to O via C called backdoor path. When the backdoor paths exist and are “open”, the estimate of effect between exposure and outcome will be biased. The variables in backdoor paths arejudged to be confounders (such as C) and we need to adjust at least one confounder to block the backdoor paths in which it is located. A variable is a collider if there are two arrows in the same path go toward it. Noted that collider is naturally blocked, it means that a backdoor path is blocked if it contains collider, and if we adjust for a collider, the backdoor paths (i.e, contain the collider) will be opened.
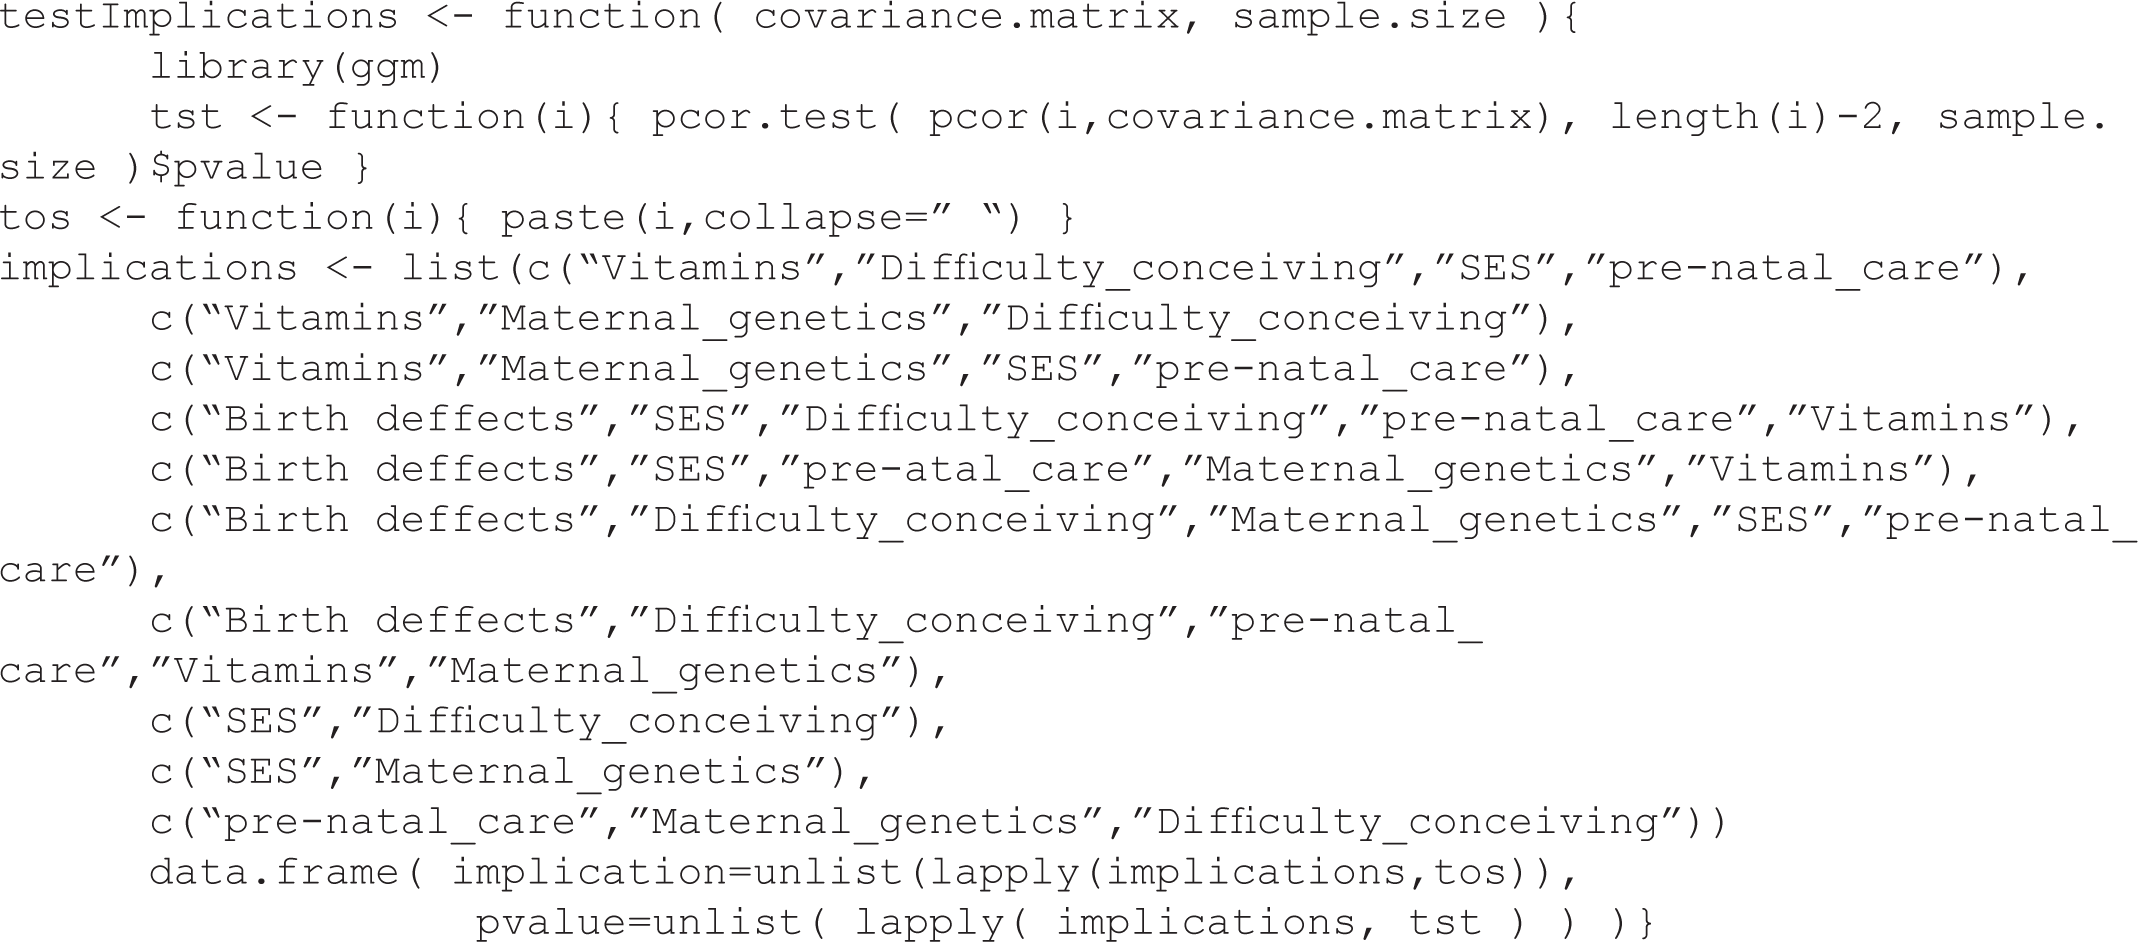
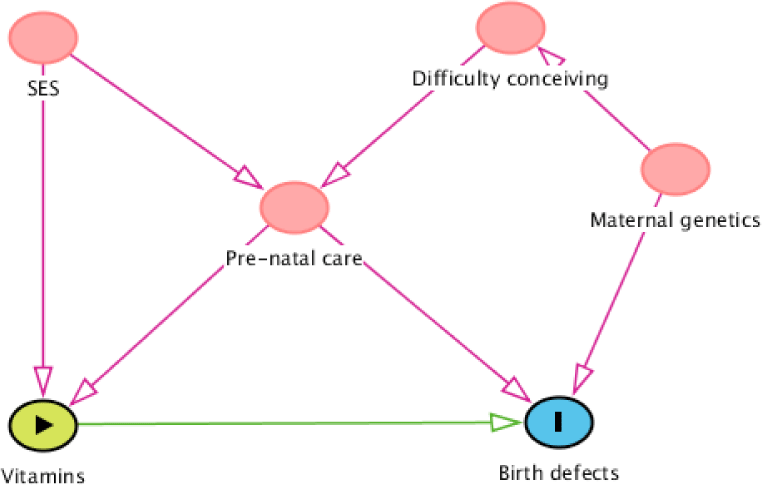
Figure 2 shows an example of a simple DAG. Suppose we want to estimate the effect of vitamins on birth defects, which variables must be adjusted for? do we need to adjust for all four variables that showed in Figure 2?. Our objective is to determine Minimal Sufficient Adjustment Sets (MSAS) that not only easy to calculate but also saving the research resource of data collection. As discussed above, all backdoor paths from birth defects to vitamins must be blocked to obtain the true effect of vitamins on birth defects. There are three opening backdoor paths: (1) Birth defects←Pre-natal care←Socioeconomic status (SES)→Vitamins; (2) Birth defects←Maternal genetics→Difficulty conceiving→Prenatal care→Vitamins; and (3) Birth defects←Pre-natal care→Vitamins; and one “natural blocked” backdoor path: (4) Birth defects←Matemal genetics→Difficulty conceiving→Pre-natal care←SES→Vitamin (because Pre-natal care is a collider in this path). The most obvious confounder is pre-natal care, it is located in all three opening backdoor paths, therefore, when we adjust for it, all the three backdoor paths will be blocked. However, the adjustment of pre-natal care doesn’t mean that all the backdoor paths are blocked. Since pre-natal care is also a collider for socioeconomic status and difficulty conceiving, adjusting for pre-natal care will open the “natural blocked” backdoor path number fourth. Therefore, adjusting for at least one more variable in the fourth backdoor path is needed. As a result, there are three possible MSAS: (1) pre-natal care and socioeconomic status; (2) pre-natal care and difficulty conceiving; (3) pre-natal care and maternal genetics. The choice then will be depended on our intent and available data.
In more complex situations we can build a DAG using the six-step approach [11] or DAG software, which is free, developed by Textor J,etal [12] and available at http://www.dagitty.net.
One of the main limitations of DAG that is only a qualitative approach thus cannot quantify the magnitude or direction of the bias. In order to calculate the magnitude of quantitative relationships, Structural equation modeling or Bayesian networks may be helpful.